In the aftermath of the 2021 M7.2 Haiti earthquake, MTPTC (Ministère des Travaux Publics, Transports et Communications), UNOPS (United Nations Office for Project Services) and Miyamoto International implemented a damage and repair assessment program. Between Octo- ber 2021 and February 2022, 380 trained engineers evaluated 179,800 buildings in the Sud, Grand’Anse and Nippes departments, reaching over 600,000 beneficiaries. The assessments were executed in compliance with ATC-20 and the Haitian standards, through an innovative digital- ized approach. More than 11,000 buildings were collapsed or not repairable; over 89,000 build- ings were damaged and repairable. Approximately 88,000 buildings were in confined masonry and over 26,000 of them could be repaired as per MTPTC guidelines; around 80,000 buildings were in the timber and stones vernacular technique. The examined dataset is one of the largest studied in recent humanitarian history and it is critical to learn from past seismic events. We herein analyze the observed structural weaknesses and make a comparison with the 2010 earth- quake.
Introduction
On August 14, 2021 at 8:29 a.m. local time, a magnitude 7.2 earthquake struck the Tiburon Peninsula in the Caribbean nation of Haiti, adversely affecting approximately 800,000 people [1,2]. With over 2300 people reported dead or missing [3], the 2021 Haiti earthquake has been the deadliest of the year. Furthermore, the emergency response by the Haiti government and the humanitarian organizations faced challenges with the ongoing COVID-19 pandemic, President Moïse’s assassination on the July 7, 2021 and the tropical depression Grace landfall in Haiti only two days after the earthquake [4].
In response to the earthquake, MTPTC (Ministère des Travaux Publics, Transports et Communications), with financial support from the World Bank, organizational and technical support of UNOPS (United Nations Office for Project Services) and Miyamoto In- ternational, aimed to assess the damage and define the repair strategy of 120,000 buildings in 3 months. Between October 2021 and February 2022, a total of 179,800 buildings were assessed.
To conduct assessments of this scale, approximately 550 engineers were trained, out of which 380 were selected for conducting the on-ground assessments. Assessments were executed in compliance with Haitian codes [5] and ATC-20 Procedures for Post
Earthquake Safety Evaluation of Buildings [6]. The latter is a well-known reference for seismic damage assessments [7] that includes rapid and detailed evaluation procedures for evaluating earthquake-damaged buildings and posting them as INSPECTED (apparently safe, green placard), LIMITED ENTRY (yellow placard), or UNSAFE (red placard). Using an innovative digitalized approach, MTPTC engineers were able to provide detailed damage and the repair needs in a single site visit with an average duration of 30 min. A data- base that comprehends details of almost 180,000 buildings was, hence, created.
More than 10 years after the deadly 2010 earthquake, the 2021 seismic event caused considerable damage in Haiti. The authors believe that learning from past earthquakes is crucial to improve the built environment resilience. The damage assessment campaign subject of this manuscript is the largest in response to the 2021 Haiti earthquake. We hereby share our findings on the observed seis- mic damage with the hope that the quality of the housing improves, and the effects of future extreme natural events on the Haitian population are minimized.
The manuscript is presented in three parts. First is a background analysis that outlines the seismic hazard and the built environ- ment that characterizes Haiti. Second is the description of the methods that we used to execute the seismic damage and repair assess- ments and third is the detailed quantitative and qualitative results. The latter is a quantitative and qualitative analysis on damaged buildings, location and typology of damage, including our observations on the field with regards to recurring vulnerabilities of the two main construction typologies found: confined masonry (CM) and the traditional timber and stones technique.
Seismic hazard in Haiti
The seismic hazard in Haiti is substantial throughout the country [8] and the built environment is prone to seismic damage [9,10]. The historic seismic events in Haiti are noted to be remarkably impactful, although not particularly frequent. In 2010, a M7.0 earth- quake with the epicenter close to the capital city Port-au-Prince claimed approximately 300,000 lives and displaced more than a mil- lion people [11,12]. Before this catastrophic event, comparable earthquakes dating back to the eighteen century (1701, 1751 and 1770), when the Enriquillo fault system, that crosses the island of Hispaniola, generated a devastating seismic sequence of events [13].
Due to ground shaking, soil liquefaction may occur in loose to moderately granular soils. The internal water pressure increases to the extent that the grains lose contact with each other, and the soil strength drops. This typical, however uncommon, seismic phenom- enon affected certain areas of Haiti during the 2010 earthquake [14,15].
The M7.2 earthquake, that is the object of our research, occurred at 8:29 a.m. local time on Saturday, August 14, 2021. The epi- center was in a rural area of the Nippes region, 13 km southeast of Petit Troup de Nippes and 125 km southwest of the capital Port-au- Prince [1]. The earthquake was generated by a blind thrust fault, followed by a strike-slip fault that caused the activation of a network of fragmented faults, west from the hypocenter [2,16]. This multi-fault rupture appears not aligned with the boundary between the Caribbean and the North American plates, indicating a regional and highly variable fault system [17,18]. The hypocenter is shallow, 10 km deep, the maximum Peak Ground Acceleration is 0.78 g (see Fig. 1) and the modified Mercalli intensity index reached the level
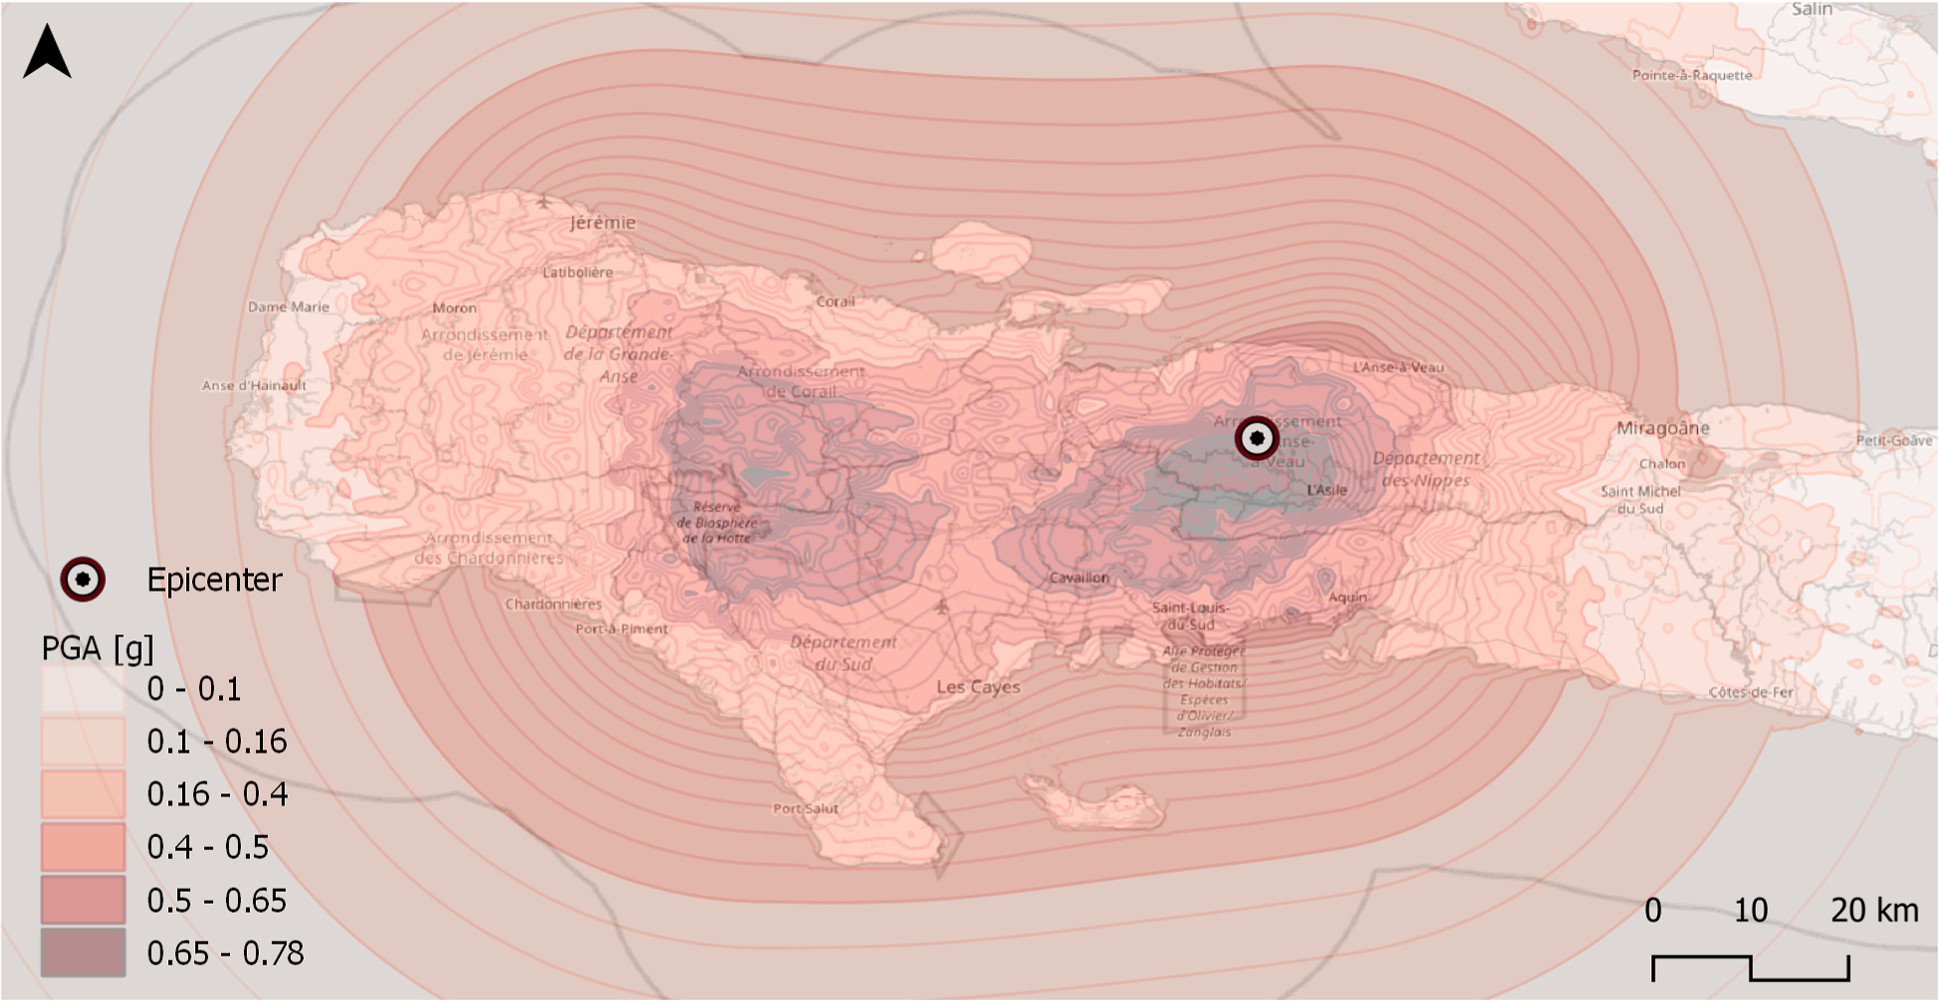
Fig. 1. Peak Ground Acceleration (PGA) and earthquake epicenter (data retrieved from USGS [1]).
of IX [1]. The NASA’s Jet Propulsion Laboratory and the California Institute of Technology’s analysis shows a permanent ground movement up to 40 cm and a development of the fault lines towards west from the epicenter [19]. The disaster resulted in approxi- mately 800,000 people being adversely affected in the Nippes, Grand’Anse and Sud regions [3,4]. Further aggravating the emergency scenario was the ongoing COVID-19 pandemic, unrest due to the assassination of the President of Haiti and the tropical depression Grace, which hit the southern coast of Haiti two days post the earthquake [4].
The Haitian built environment
The Haitian built environment mainly consists of informal settlements in confined masonry, and traditional timber and stones buildings. The latter is more common in rural areas and consists of a timber frame and roof, with unreinforced stone masonry (stone URM) infill walls (see Fig. 2). These typically are single-story buildings, where the ground floor can be rammed earth or a concrete slab-on-grade. The timber posts are embedded in the ground floor and connected to the beams with a notch and a dowel; they are 60 cm–100 cm spaced. Other connections are mostly notches, nails and (rarely) ropes. The roof is in timber trusses, supported also by internal posts and covered with corrugated metal sheets. The unreinforced stone infill walls are not connected to the timber frame. Stones are mostly angular, the mortar can be mud mortar, or contain cement. Openings are framed with timber and plaster is often ap- plied. The typical footprint area is between 15 and 50 sqm, and internal and external walls are built with the same technique.
Haitian vernacular buildings have been praised for their overall positive seismic behavior and they show the value of indigenous technical knowledge [20,21]. The roof is light and most of the seismic weight is provided by the URM walls. The timber frames con- fine the unreinforced masonry, creating a resisting system particularly effective in its plane and optimized out of its plane, as the URM portions are limited in size. Despite their positive performance in past seismic events, the Haitian traditional techniques that we will partially herein address are a marginal topic in the current literature [22]. Our findings on their seismic performance and the struc- tural systems resisting vertical and horizontal loads are described in section 4.4.
We herein refer to Confined Masonry (CM) buildings for those structures that show lightly reinforced columns and beams, with unreinforced concrete blocks infill walls. Foundations are typically shallow, mostly slab on grade. The floors are in reinforced con- crete and function as rigid diaphragms: they are heavy, but they are effective in distributing the horizontal forces among the vertical structural members. The roof is light and typically pitched, the structure is in timber and metal corrugated sheets; although, espe- cially in the urban areas, it can be flat and in reinforced concrete. Most of the buildings are single or double-story buildings, with a 15 to 80 sqm footprint. Often, the construction material is of poor quality, trained practitioners are not involved in the construction process, and CM seismic behavior results variable [10,23,24]. In the aftermath of 2010 earthquake, inadequate CM construction methods and material were recognized as main causes of the devastation [10].
Confined masonry per se can be an effective typology to withstand horizontal forces, but the structural details and the quality of the material must be adequate [25]. CM confine and reduce the size of URM walls with horizontal and vertical reinforced concrete el- ements. The resistance to horizontal forces is mainly provided by walls reacting in their plane, while out-of-plane resistance is minor. As shown in Fig. 3, a proper CM wall is interlocked with the columns and beams that are poured after the wall has been built. By doing so, the lightly reinforced concrete frame and the URM infill walls collaborate, exceeding the seismic performance that they would have singularly. MTPTC made freely available guidelines that address the whole construction process of CM [5]; representing a reli- able and effective document which masons and building owners can refer to (see Figs. 3 and 14).
Pure RCC frames, where the infill walls are built after the frame, are also minorly present in the local built environment (see Fig.
3). As per CM, the quality of the material is low and the reinforcement bars’ number and size inadequate.
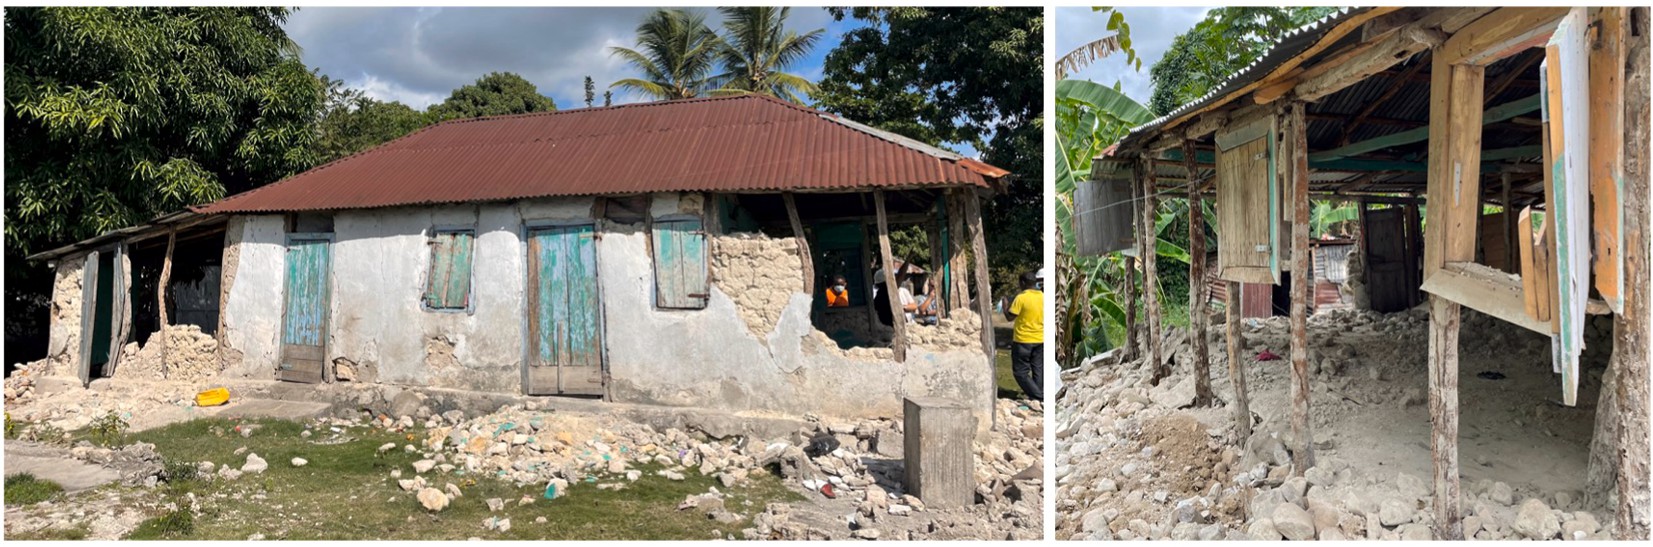
Fig. 2. Damaged timber and stones buildings (Les Cayes and Cavaillon, 2021).
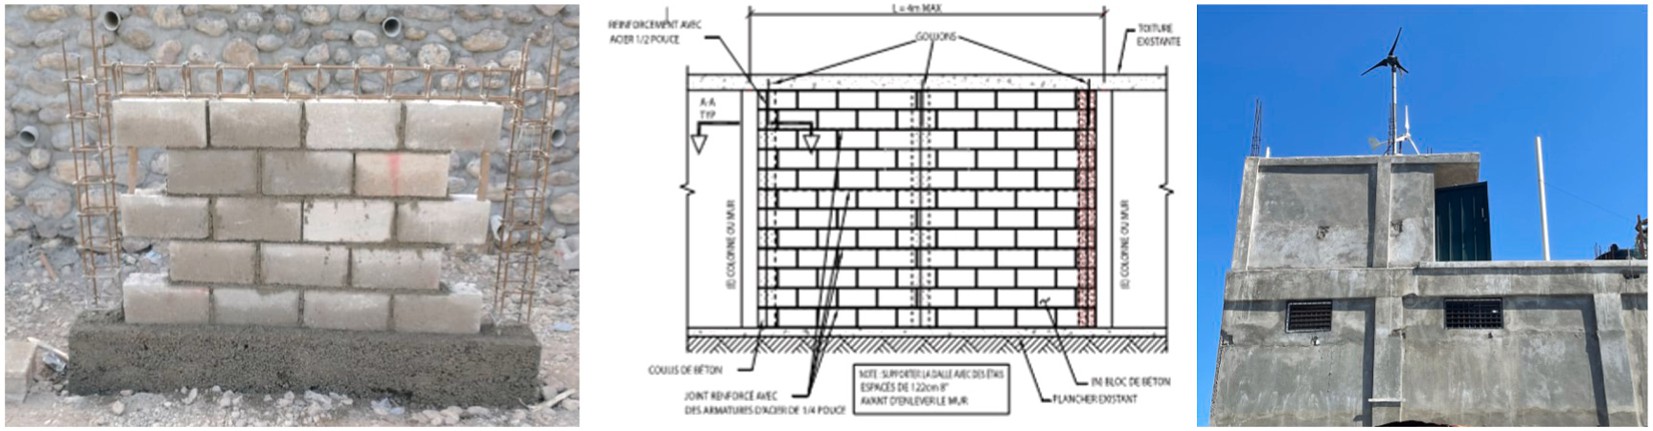
Fig. 3. Left: Reinforced Concrete building (Les Cayes, 2021). Center: correct CM wall construction (L’Asile, 2022). Right: detail of a CM wall on MTPTC guidelines.
Methodology
In the aftermath of the August 14, 2021 seismic event, the Haitian Government, through MTPTC (Ministère des Travaux Publics, Transports et Communications) and BTB (Bureau d’evaluation Technique des Bâtiments), with funds provided by the World Bank, lo- gistic support provided by UNOPS (United Nations Office for Project Services) and technical support provided by Miyamoto Interna- tional, implemented a damage and repair assessment program that covered the Sud, Grand’Anse and Nippes regions.
A three-days training for 550 engineers was conducted in multiple cities of Haiti (i.e. Port-au-Prince, Les Cayes, Jeremie and Anse- a-Veu). The training addressed Procedures for Post-Earthquake Safety Evaluation of Buildings as per ATC-20 standards [6] adapted to the local context and MTPTC official guidelines [5]. In the 1980s, the Applied Technology Council partnered with the Structural Engi- neers Association of California (SEAOC), the California Office of Emergency Services (OES), the California Office of Statewide Health Planning and Development (OSHPD) and the Federal Emergency Management Agency (FEMA) to produce guidelines to perform safety assessments of buildings after seismic events. From the 2010 earthquake and onward, the Government of Haiti adopted ATC-20 as reference for the assessment of the buildings’ safety, adapting its framework to the Haitian construction typologies [12]. Also con- sidering that the local engineers were already familiar with them, the 2021 earthquake response adopted ATC-20 guidelines as refer- ence. The training included principles of seismic engineering (e.g. earthquakes measurement methods, seismicity in Haiti, construc- tion typologies, ductility principles, periods of vibrations, non-structural elements, geotechnical hazards and liquefaction), typical structural weaknesses (e.g. vertical and horizontal irregularities, soft story, captive column, pounding, torsional effects), details on the evaluation process (e.g. initial, detailed and engineered evaluation, evaluation steps, health and safety, difference between safety and damage), damage assessment tags (green – inspected and safe, yellow – restricted use and red – unsafe), typical repair details and repair technical specifications. Selection of engineers was determined by a post training assessment which resulted in 380 engineers being deployed in the field.
Between October 2021 and February 2022, a team of 574 professionals implemented the damage and repair assessment data col- lection. Each division comprised of three teams, with six engineers in each team, and a division leader, resulting in a total of 19 engi- neers per division. For damage and repair assessments, engineers worked in pairs, with the support of one social communicator (180 in total). In the field, a maximum of 20 divisions were deployed, consisting of 300 evaluation engineers, along with 60 evaluation en- gineers who also served as team leaders, and 20 division leaders, totaling 380 MTPTC engineers. The MTPTC engineers were under the supervision of 14 experts from Miyamoto International.
The assessments initiated from Les Cayes, the city that was most affected by the earthquake, Jeremie and Anse-a-Veu; the aim was to visit the most affected areas of the Sud, Grand’Anse and Nippes regions. The deployment strategy was revised weekly and plans with the areas to be covered were distributed to each division leader. The teams, moving along primary and secondary roads, assessed any building (i.e. residential, commercial, industrial, religious, governmental, schools, healthcare, etc.) they could get access to, by being granted permission by the building occupant. The goal of the project was to assess as many buildings as possible in the desig- nated areas. If nobody was occupying the building, support was sought by the local community to contact the owner. If the building could not be assessed, the team moved forward. The enumerators progressively moved away from main cities and villages, towards rural areas; when undamaged areas were reached, they were relocated to other locations identified by the government as impacted by the earthquake. The progress was monitored through ArcGIS maps and coordinated with the local authorities. Haiti is one of the poor- est countries in the world [26,27], where informal settlements are extremely common and the real estate registry is not adequately maintained [28,29]. As a result, it is not possible to calculate an index of completeness of the inspections.
At each site visit, the assessment was twofold: the social mobiliser executed a social survey, whose aim was to collect data on the vulnerability of the household and on the impact that the earthquake had on their livelihood. Secondly, the engineers implemented a technical survey, focused on the damage occurred to the building and, if applicable, the repair strategy. The latter was compliant with ATC-20 and MTPTC standards. The data collected include the general characteristics of the building (e.g. footprint area, year of con- struction and/or renovation, number of floors, construction technique, type of roof, type of walls, type of foundations) and the level of damage (null, minor, moderate or major) for each type of structural and non-structural element (e.g. foundations, walls, slabs, roof, columns, beams, parapets). A tag was assigned to each building: green (safe to be occupied), yellow (entry is restricted) and red (un- safe, entry is forbidden). The tag was sprayed to the main façade, close to the QR code that uniquely identifies the building. If dam- aged occurred and the building was repairable as per MTPTC guidelines, a repair assessment followed. MTPTC guidelines only apply to confined masonry structures and assign a code to each typical repair type (e.g. A1 – replacement of a wall cracked in its plane, D1 –
lintel replacement, F3 – major crack repair). Engineers captured photo documentation and recorded the measurements of each repair type.
The whole data collection campaign was carried out digitally: the engineers and social mobilisers used a tablet and open-source app KoBoToolbox [30] to record the evaluations. The most important questions (e.g. building tag, repairability) were compulsory and the survey could not be completed unless they were responded. By doing so, loss of data was mitigated. If the building had collapsed, information on its characteristic could often not be gathered (e.g. floor area, use of the building, age, construction typology) and the engineers responded to what could be confirmed by the owners or tenants, and what could be observed. The data collected was moni- tored and analyzed with ArcGIS and PowerBI in real time by an international team of experts. Recurring errors were identified during the campaign and addressed through timely and continuous communication with the team on the field.
Through an algorithm linked to the database, damage and repair reports, including the material quantities needed to repair the building, were produced to be downloaded by the homeowners through the QR code affixed to their building at the time of the visit. The QR codes were printed by a unique source to avoid duplicates and were distributed to the division leaders weekly.
Overview of the results
179,800 buildings have been evaluated.
⁃ Approximately 600,000 beneficiaries have been reached.
⁃ Approximately 10 million square meters of buildings have been assessed, with an average of 60 sqm per building.
⁃ 168,144 were primarily for residential use (93%), 4356 commercial (2.4%), 3209 (1.8%) “other” (e.g. storage, toilets,
unknown), 1871 scholastic (1%), 1318 religious (0.7%), 351 healthcare (0.1%), 270 community centers, 174 industrial and 107 governmental.
⁃ 152,613 single-story buildings (85%), 16,995 double-story buildings (9%), 1251 buildings three-story buildings (0.6%), 123 four-story building and 29 buildings were up to six stories.
⁃ 61,910 buildings were less than 10 years old (35%), 61,323 buildings were between 11 and 25 years old (34%), 26,878 buildings were between 26 and 50 years old (15%), 5986 were more than 50 years old (3%) and for 23,703 the age of construction was unknown (13%).
⁃ 88,204 were in confined masonry (49%), 80,808 in the local traditional techniques (44.9%) (i.e. clissage or timber and stone masonry).
⁃ 8636 are completely collapsed (4.8%), 28,364 are tagged red (15.8%), 73,297 are tagged yellow (40.8%), 69.503 are tagged green (38.6%). Fig. 4 illustrates the geographic distribution of the tags, while Fig. 5 shows the tag distribution in function of the PGA areas. Traditional buildings showed more damage than CM buildings, although, unfortunately, as mentioned in the methodology, data on collapsed buildings is missing (see Table 1). Their behavior is analyzed further in section 6.
⁃ The trends forthcoming in analysis of the damage levels by buildings’ age (see Table 2 and Fig. 6) showcase that the percentage of green tag buildings progressively reduces, while the percentage of red tags and completely collapsed structures increases, as the structures’ age increases. The 2010 earthquake raised awareness on the seismic risk and construction best practices, also through the dissemination of CM official guidelines; this may have fostered an enhancement of the construction works in general from 2010 onwards.
⁃ On the other hand, trends also suggest that green tags increases, and red tags decreases as the number of stories increases; this could be due to the fact that 85% of the assessed building stock was single-story and typically informally constructed, whereas buildings with one or more elevated floors require more financial efforts and, probably, called for more knowledgeable masons who implemented better structural details. Furthermore, vernacular architecture was typically single-story and showed clear susceptibility to more damage. Table 3, in fact, also shows that buildings with more than one story are predominantly in CM. Another explanation could be that the type of occurred seismic event was more severe for periods of vibrations of single-story structures.
Tags assigned to the assessed buildings: green tag (safe to be occupied), yellow tag (restricted entry), red tag (unsafe), completely collapsed, for the all the dataset and by construction typology (confined masonry and traditional buildings).
s
| Total number of buildings | CM buildings | Traditional building | |||||||
| [N] | [%] | [N] | [%] | [N] | [%] | ||||
| Green tag | 69,503 | 38.6% | 54,784 | 62.1% | 13,988 | 17.3% | |||
| Yellow tag | 73,297 | 40.8% | 23,141 | 26.2% | 49,274 | 61% | |||
| Red tag | 28,364 | 15.8% | 10,279 | 11.7% | 17,546 | 21.7% | |||
| Completely collapsed | 8636 | 4.8% | – | – | – | – | |||
| 179,800 | 100% | 88,204 | 100% | 80,808 | 100% |
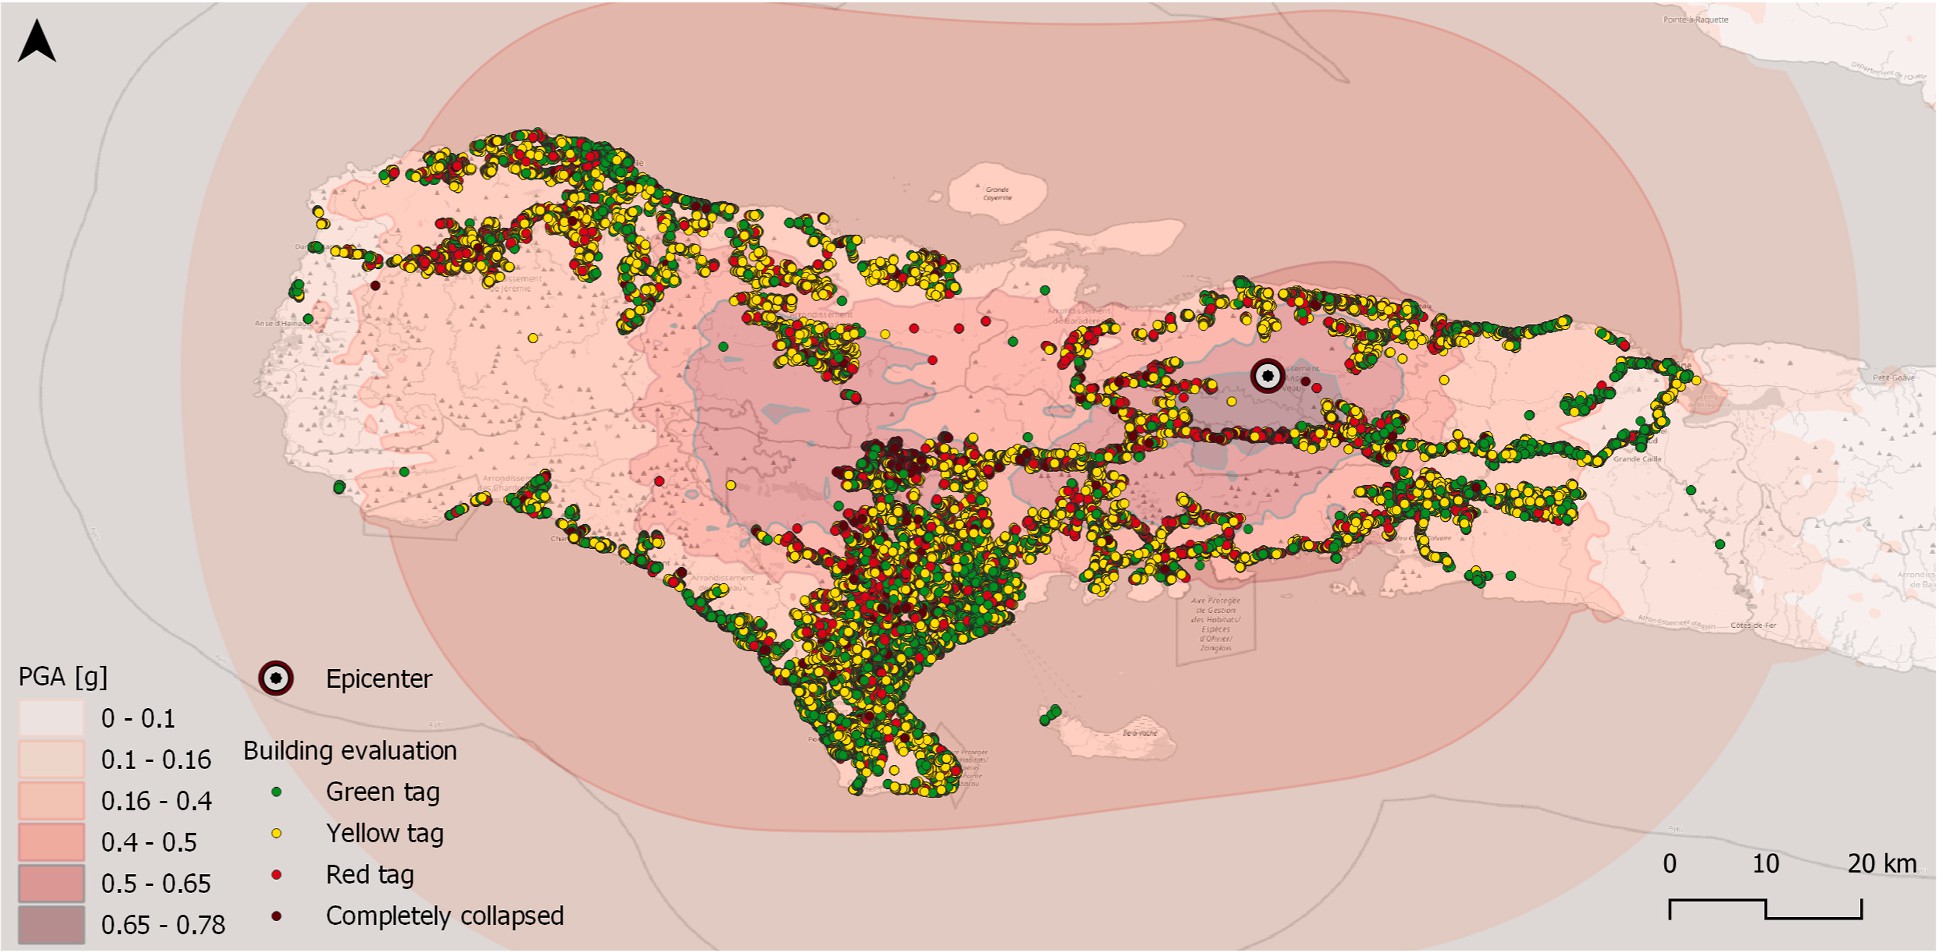
Fig. 4. Damage (buildings’ tag) map plotted on the Haiti 2021 PGA (Peak Ground Acceleration) map. Consistently with the PGA map, most of the damage is concen- trated west from the epicenter.
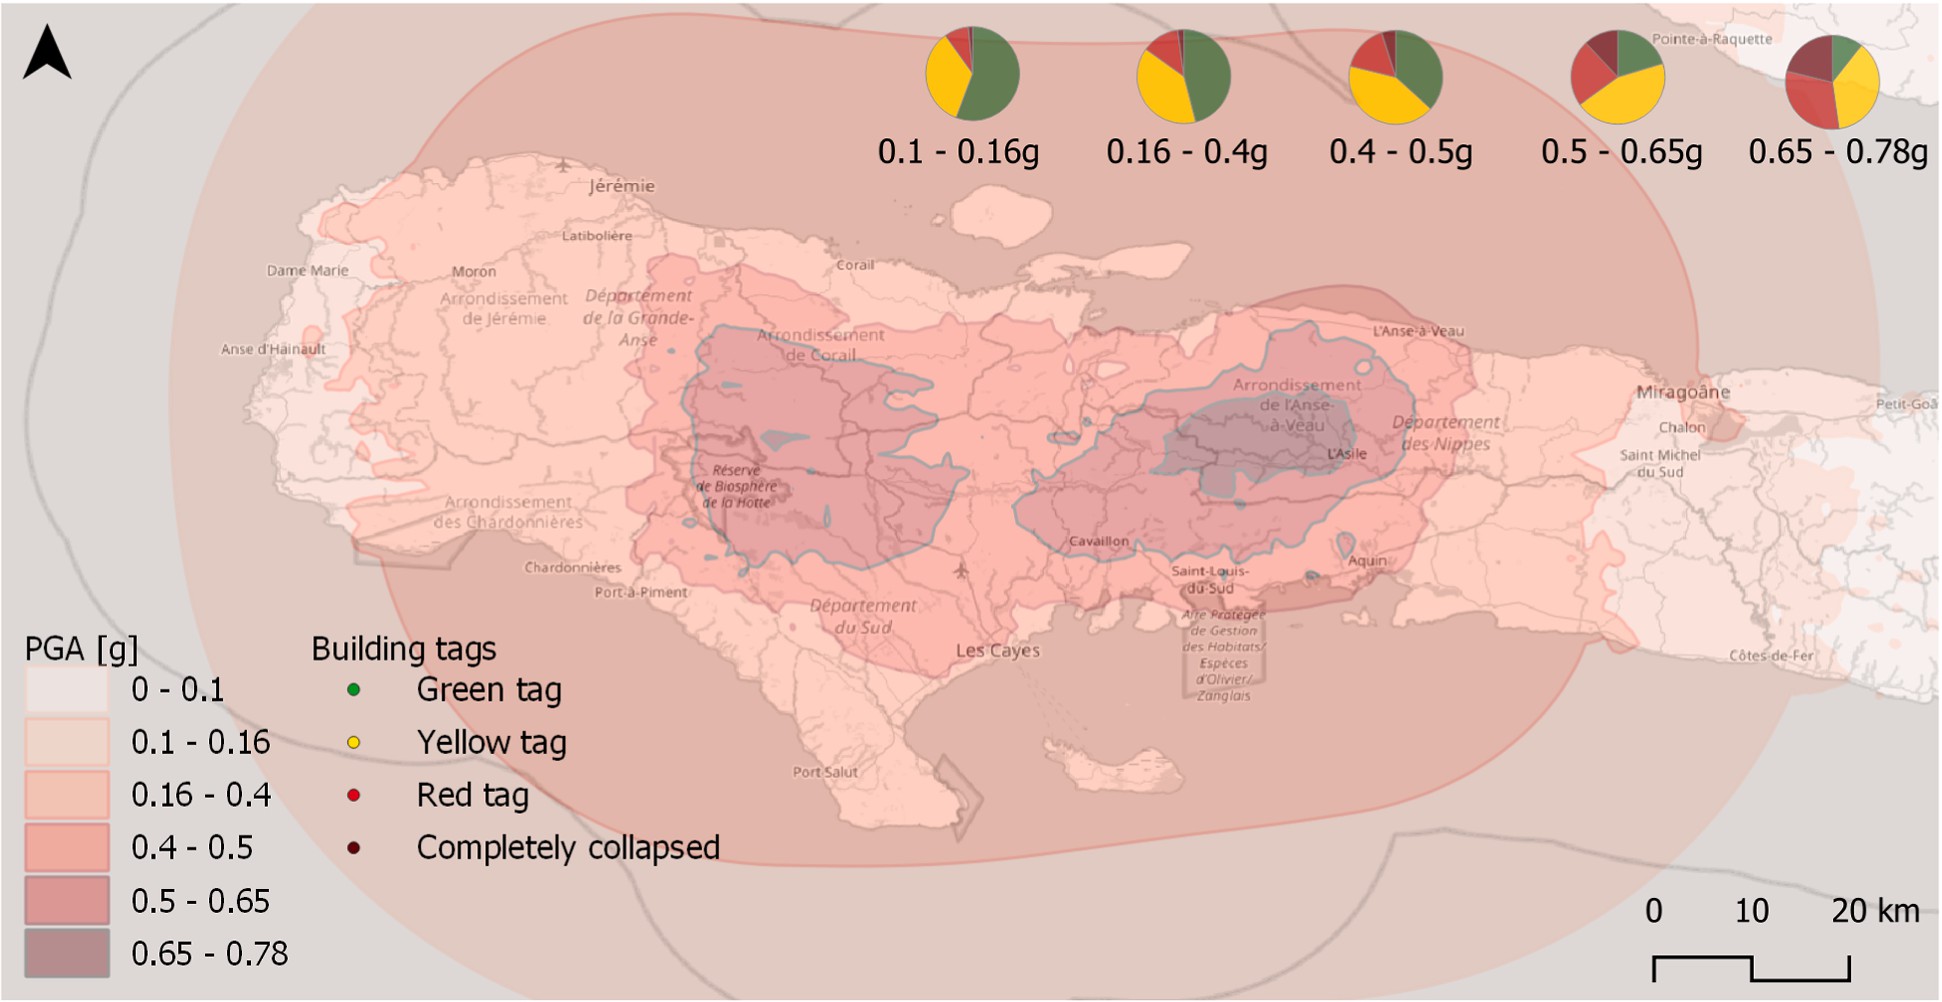
Fig. 5. Distribution of green tagged, yellow tagged, red tagged and completely collapsed buildings associated to PGA levels. (For interpretation of the references to colour in this figure legend, the reader is referred to the Web version of this article.)
⁃ Furthermore, 70,178 buildings (39.1%) do not need any repair (either because they are green tagged or because they were already under reconstruction), 62,978 buildings (35%) are repairable but MTPTC guidelines do not apply (either because the construction technique is not confined masonry or because the building structure is too complex and needs further evaluation), 26,464 buildings (14.7%) can be repaired as per MTPTC guidelines, 20,180 buildings (11.2%) are not repairable or completely collapsed (see Table 4).
⁃ Table 5 outlines the damage occurred to the primary structural elements. For both CM and vernacular buildings, and in line with ATC-20 standards, damage to columns and walls predominantly correlates with yellow and red tags. Damage to horizontal elements, such as beams, slabs, stairs and balconies appears less frequent. Walls damage is the most recurring type of damage; however, damage to vertical elements such as walls and columns seems more extensive in traditional buildings, which
Tags assigned to the assessed buildings by construction age and number of stories.
Less than 10 years old Between 11 and 25 years old Between 26 and 50 years old Over 50 years old
| [N] | [%] | [N] | [%] | [N] | [%] | [N] | [%] | |||||||
| Green tag | 34,877 | 56% | 21,290 | 35% | 4545 | 17% | 644 | 11% | ||||||
| Yellow tag | 19,710 | 32% | 27,678 | 45% | 13,754 | 51% | 2851 | 48% | ||||||
| Red tag | 5643 | 9% | 9392 | 15% | 6651 | 25% | 1947 | 32% | ||||||
| Completely collapsed | 1680 | 3% | 2963 | 5% | 1928 | 7% | 544 | 9% | ||||||
| 61,910 | 100% | 61,323 | 100% | 26,878 | 100% | 5986 | 100% | |||||||
| Single-story Double-story Three stories More than four stories | ||||||||||||||
| Green tag | 59,207 | 37% | 9307 | 55% | 833 | 66% | 82 | 55% | ||||||
| Yellow tag | 67,525 | 42% | 5419 | 32% | 259 | 21% | 51 | 34% | ||||||
| Red tag | 25,881 | 16% | 2269 | 13% | 159 | 13% | 17 | 11% | ||||||
| 152,613 | 100% | 16,995 | 100% | 1251 | 100% | 129 | 100% | |||||||
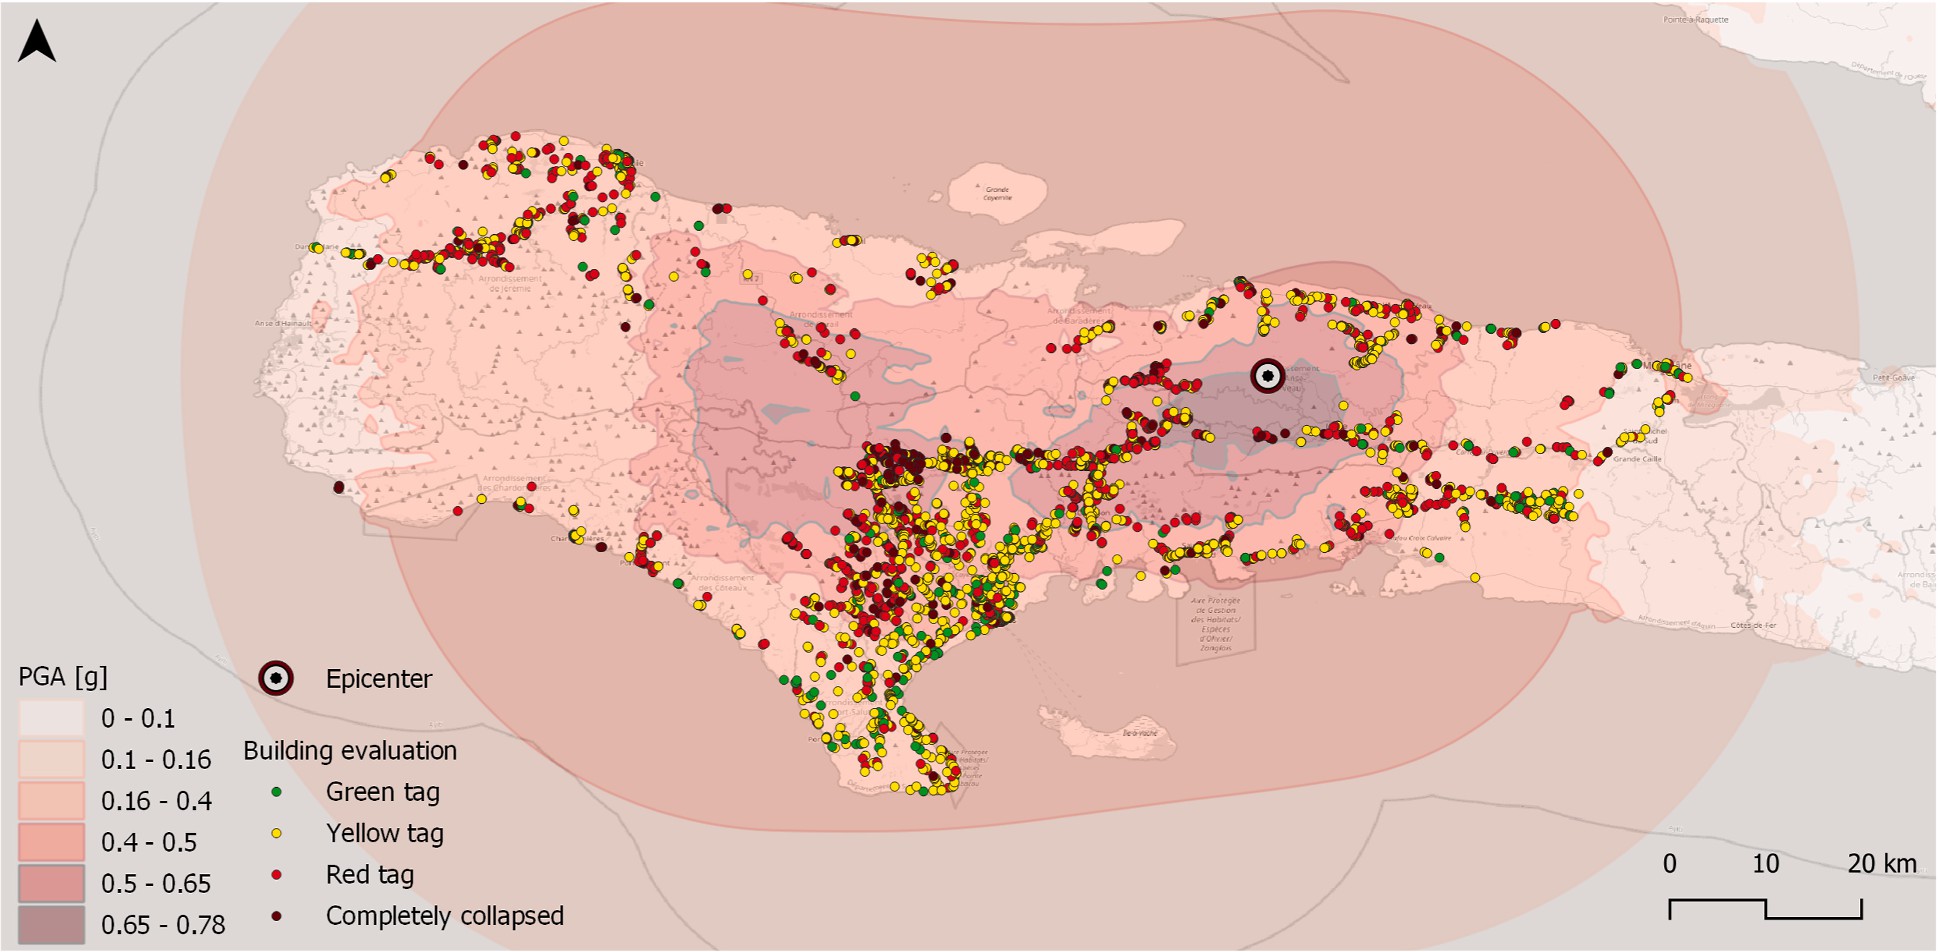
Fig. 6. Over 50 years old buildings have been damaged significantly more than the others on average, also in low PGA area (e.g. north-west).
Correlation between type of building and number of stories.
Single-story Double-story Three stories More than four stories
| Confined Masonry | 74,705 | 85% | 12,052 | 13% | 1206 | 1.4% | 225 | 0.6% |
| Traditional | 75,887 | 93.9% | 4817 | 5.9% | 43 | 0.1% | 16 | 0.1% |
| 152,613 | 100% | 16,995 | 100% | 1251 | 100% | 129 | 100% |
Damage to main structural elements by building tag and by construction typology (percentages note the level of damage, which can be null, minor, moderate and major, per each tag).
| CONFINED MASONRY | |||||||
| Green tag | Yellow tag | Red tag | Overall | ||||
| Internal and external walls damage | Null | 26,009 (47.5%) | 716 (3%) | 289 (3%) | 27,014 (31%) | ||
| Minor | 28,123 (51.4%) | 4147 (18%) | 475 (5%) | 32,745 (37%) | |||
| Moderate | 546 (1%) | 16,402 (31%) | 2084 (20%) | 19,032 (21%) | |||
| Major | 91 (0.1%) | 1774 (8%) | 7414 (72%) | 9279 (11%) | |||
| Columns damage | Null | 48,959 (89.4%) | 14,356 (24.4%) | 1828 (18%) | 65,143 (74%) | ||
| Minor | 5703 (10.4%) | 5553 (24%) | 1565 (15%) | 12,821 (15%) | |||
| Moderate | 83 (0.1%) | 2989 (13%) | 3484 (34%) | 6556 (7%) | |||
| Major | 24 (0.1%) | 140 (0.6%) | 3385 (33%) | 3549 (4%) | |||
| Floors, roofs and beams damage | Null | 49,317 (90%) | 16,244 (70%) | 4329 (42%) | 69,890 (79%) | ||
| Minor | 5323 (9.8%) | 4426 (19%) | 1480 (14%) | 11,229 (13%) | |||
| Moderate | 104 (0.1%) | 2246 (10%) | 2265 (22%) | 4615 (5%) | |||
| Major | 25 (0.1%) | 122 (1%) | 2188 (22%) | 2335 (3%) | |||
| Stairs, parapets and balconies damage | Null | 51,624 (94.2%) | 19,856 (86%) | 7299 (71%) | 78,779 (89%) | ||
| Minor | 3062 (5.6%) | 2301 (10%) | 985 (10%) | 6348 (7%) | |||
| Moderate | 67 (0.1%) | 811 (3%) | 891 (8%) | 1769 (2%) | |||
| Major | 16 (0.1%) | 71 (1%) | 1087 (11%) | 1174 (2%) | |||
| TRADITIONAL | |||||||
| Green tag | Yellow tag | Red tag | Overall | ||||
| Internal and external walls damage | Null | 6337 (45.3%) | 4334 (9%) | 1304 (7%) | 11,975 (15%) | ||
| Minor | 7276 (52%) | 5534 (11%) | 407 (3%) | 13,217 (16%) | |||
| Moderate | 322 (2.3%) | 32,526 (66%) | 3507 (20%) | 36,335 (45%) | |||
| Major | 51 (0.4%) | 6867 (14%) | 12,321 (70%) | 19,239 (24%) | |||
| Columns damage | Null | 12,457 (89.1%) | 32,349 (65.7%) | 5339 (30%) | 50,145 (62%) | ||
| Minor | 1454 (10.4%) | 10,027 (20.3%) | 2083 (12%) | 13,564 (17%) | |||
| Moderate | 61 (0.4%) | 6557 (13.3%) | 4999 (28%) | 11,617 (14%) | |||
| Major | 14 (0.1%) | 328 (0.7%) | 5118 (30%) | 5460 (7%) | |||
| Floors, roofs and beams damage | Null | 12,796 (91.5%) | 41,068 (83%) | 11,645 (67%) | 65,509 (81%) | ||
| Minor | 1137 (8.1%) | 4535 (9%) | 1453 (8%) | 7125 (9%) | |||
| Moderate | 44 (0.3%) | 3510 (7%) | 1984 (11%) | 5538 (7%) | |||
| Major | 9 (0.1%) | 148 (1%) | 2457 (14%) | 2614 (3%) | |||
| Stairs, parapets and balconies damage | Null | 13,087 (93.6%) | 43,882 (89%) | 13,840 (79%) | 70,809 (88%) | ||
| Minor | 853 (6.1%) | 3053 (6%) | 961 (5%) | 4867 (6%) | |||
| Moderate | 39 (0.2%) | 2197 (4%) | 1037 (6%) | 3273 (4%) | |||
| Major | 7 (0.1%) | 129 (1%) | 1701 (10%) | 1837 (2%) | |||
corroborates the perception on the field (see Section 6.2). It is worth noting that data on completely collapsed buildings is lacking, which could provide further insights into the extent of damage experienced by different building types.
⁃ Similar to the approach used to evaluate the damage occurred to churches after Italy 2016 earthquakes [31], the survey collected data on each damage mechanism (see Table 6), which can also be associated with a repair detail under MTPTC guidelines. Over one quarter of all the repair types recorded is the replacement of walls with openings damaged in shear in their plane (X-shape), followed by crack repairs and reinstatement of wall connections (or keys).
The damage is spread across the western regions of Haiti (Sud, Grand’Anse and Nippes departments); although, consistently with the PGA areas, most of the damage appears to have developed west from the epicenter (see Figs. 1 and 4). Following a methodology comparable to the one adopted for 2016 Indonesia Earthquake [32], the results of the damage assessments (green, yellow, and red tags) have been compared with the ground motion (PGA) (see Fig. 5). It is thereby evident that green tags are predominant in areas with low PGA and progressively decrease moving towards high PGA areas; whereas red tags and collapsed buildings progressively in- crease as the PGA level rises. The share of yellow tagged buildings appears to be approximately constant in all areas. For clarity, Table 7 represents the number of buildings evaluated in each PGA area, as 0.1–0.16 g and 0.65–0.78 g areas are considerably smaller in size and are in rural areas, no relevant city is located there. As a result, the amount of evaluation is less than the other PGA areas.
Following a similar approach as the one used in 2020 in Croatia [33], the damage has been analyzed in function of the building’s characteristics: Fig. 6 shows that over 50 years old buildings have been affected by the earthquake significantly more, also in areas with low PGA (such as the north-west). See also Tables 1, 2 and 8 and section 5.2 for correlations between the buildings’ tag and the construction typology, the building’s age, and number of stories.
For over 4000 buildings, major soil movement was observed in the surroundings of the building. These buildings are mostly asso- ciated to red tags (87% red, 12% yellow and 1% green) and their distribution does not seem to be directly associated to the PGA levels (see Fig. 7). In fact, liquefaction was observed in various areas where the PGA was under 0.4 g (see section 6.1 and Fig. 12), which could partially explain the red tags in low PGA areas, as it caused tilting, foundation, and slab damage. The reminder red tags in low PGA areas could be due to the low quality of CM buildings and the high-damage tendency of vernacular architecture, as outlined in sections 6.1 and 6.2.
Table 8 confirms the prevalence of single-story buildings (see also Table 3), with construction on multiple levels being more commonly observed in confined masonry rather than indigenous traditional techniques. Additionally, traditional techniques seem to exhibit greater susceptibility to damage compared to CM buildings, irrespective of the PGA area and the number of stories. Both CM and vernacular buildings demonstrate an increase in damage with higher PGA values. We also note that the geographical areas that experienced higher PGA levels were mostly rural and, in fact, present a larger component of vernacular buildings.
Number of green tagged, yellow tagged, red tagged and completely collapsed buildings associated to PGA levels.
| Green tag | Yellow tag | Red tag | Collapsed | |||||
| 0.1–0.16g | 1657 | 56% | 1020 | 34% | 251 | 9% | 43 | 1% |
| 0.16–0.4g | 39,302 | 46% | 33,262 | 39% | 11,067 | 13% | 1804 | 2% |
| 0.4–0.5g | 22,790 | 37% | 26,131 | 42% | 10,101 | 15% | 3020 | 5% |
| 0.5–0.65g | 5405 | 20% | 11,871 | 45% | 6095 | 23% | 3178 | 12% |
| 0.65–0.78g | 277 | 11% | 970 | 37% | 812 | 31% | 552 | 21% |
Correlation between tag, construction typology, number of stories and PGA level.
Single story Two stories Three or more stories
Green tag Yellow tag Red tag Green tag Yellow tag Red tag Green tag Yellow tag Red tag 0.1–0.16 g PGA 0.1–0.16 g PGA 0.1–0.16 g PGA
| CM | 1318 | 87% | 264 | 28% | 39 | 17% | 107 96% | 19 | 24% | 7 | 32% | 3 100% | 0 | – | 0 | – | ||
| Traditional | 196 | 13% | 669 | 72% | 187 | 83% | 5 4% | 61 | 76% | 15 | 68% | 0 0% | 0 | – | 0 | – | ||
| 0.16–0.4g PGA | 0.16–0.4g PGA | 0.16–0.4g PGA | ||||||||||||||||
| CM | 24086 74% | 8370 | 29% | 2560 | 28% | 4926 87% 1578 | 44% | 609 | 40% | 608 99% 210 | 89% | 109 | 92% | |||||
| Traditional | 8499 | 26% | 20623 | 71% | 6542 | 72% | 719 | 13% 1992 | 56% | 895 | 60% | 7 | 1% | 25 | 11% | 10 | 8% | |
| 0.4–0.5g PGA | 0.4–0.5g PGA | 0.4–0.5g PGA | ||||||||||||||||
| CM | 16079 83% | 8473 | 35% | 4127 | 44% | 2871 95% | 699 | 55% | 302 | 65% | 270 100% 46 | 85% | 38 | 93% | ||||
| Traditional | 3220 | 17% | 16020 | 65% | 5351 | 56% | 162 | 5% | 568 | 45% | 164 | 35% | 1 | 0% | 8 | 15% | 3 | 7% |
| 0.5–0.65g PGA 0.5–0.65g PGA 0.5–0.65g PGA | ||||||||||||||||||
| CM | 3972 79% | 2938 | 26% | 2156 | 37% | 430 | 91% | 335 | 73% | 159 | 69% | 24 | 96% | 20 | 95% | 13 | 81% | |
| Traditional | 1061 21% | 8361 | 74% | 3619 | 63% | 40 | 9% | 124 | 27% | 72 | 31% | 1 | 4% | 1 | 5% | 3 | 19% | |
| 0.65–0.78g PGA 0.65–0.78g PGA 0.65–0.78g PGA | ||||||||||||||||||
| CM | 201 | 73% | 161 | 17% | 151 | 19% | 1 100% | 2 | 100% | 7 | 100% | 0 | – 0 | – 0 – | ||||
| Traditional | 75 | 27% | 805 | 83% | 659 | 81% | 0 0% | 0 | 0% | 0 | 0% | 0 | – 0 | – 0 – | ||||
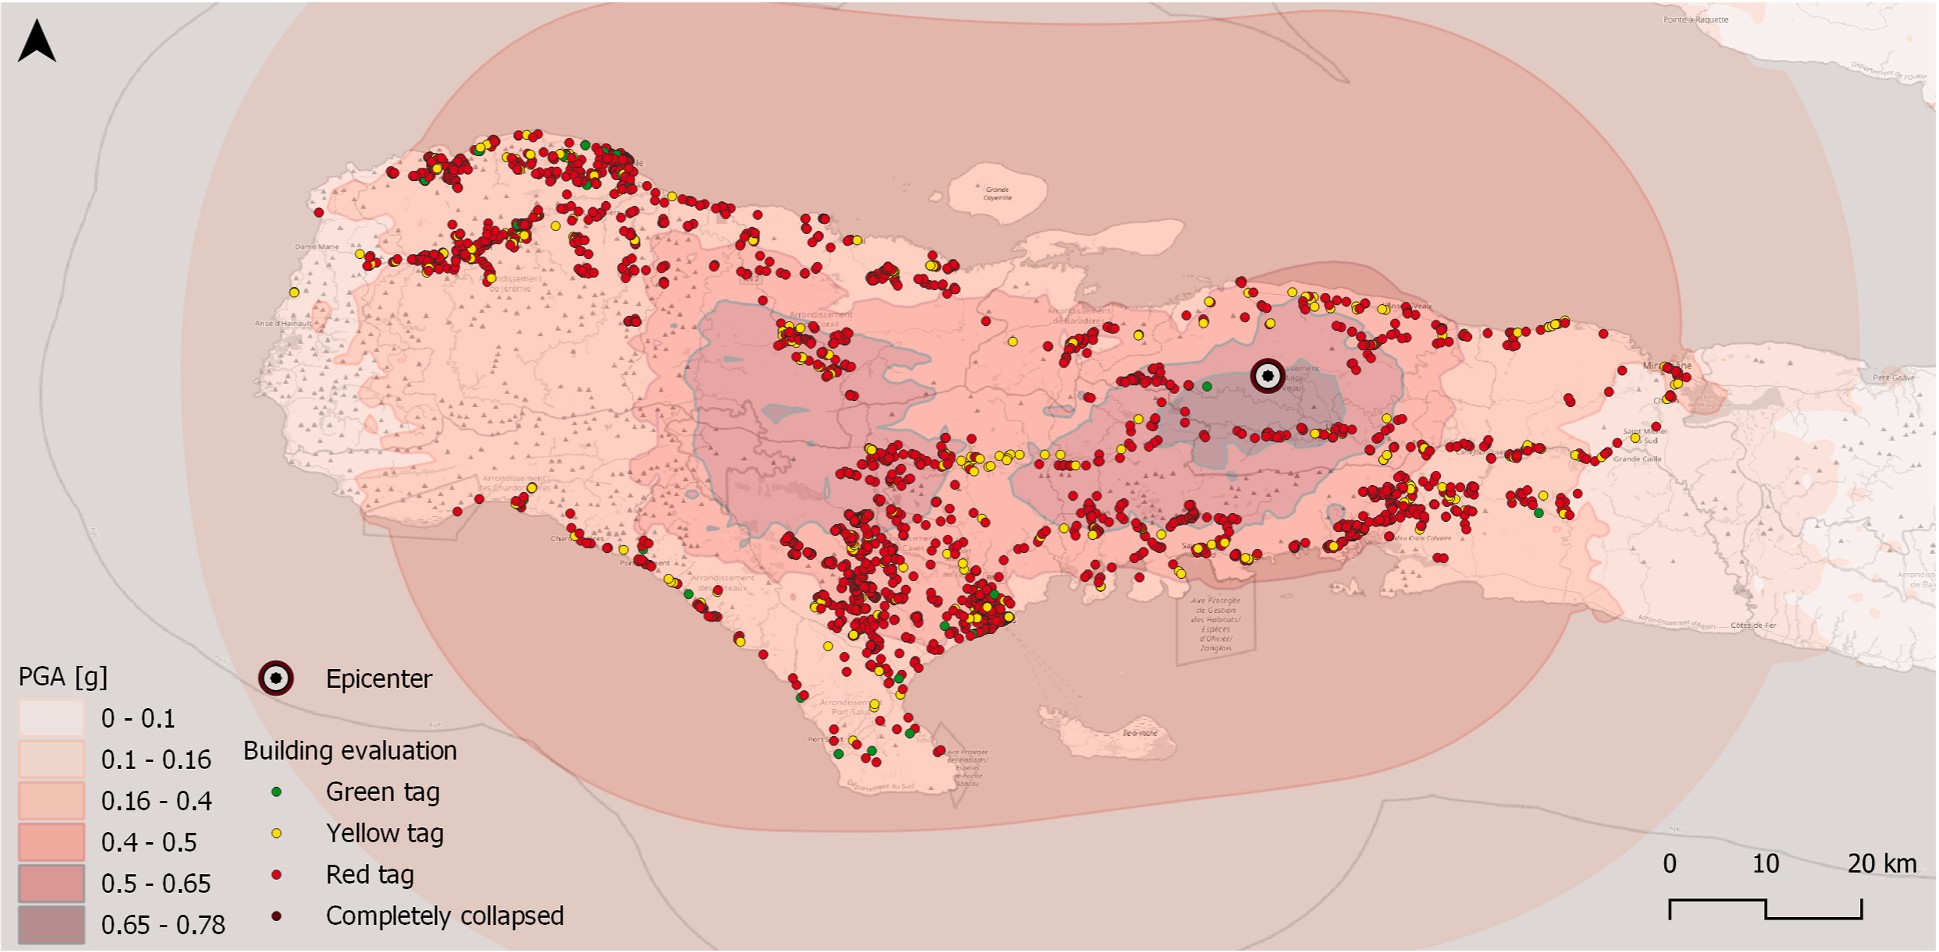
Fig. 7. Buildings where major soil movement was noted (4,025).
Different construction typologies and their performance
Compared to 2010 earthquake, the quality of the built environment may have improved, but mostly in the areas impacted by that seismic event (i.e. Port-au-Prince). Therefore, it is still not adequate to withstand the seismic demand that characterizes Haiti.
Typical observed vulnerabilities.
⁃ In the so-called incremental housing, the tendency is to build as many floors as possible over the years, leaving the column starter bars exposed to the weather for indefinite time (see Fig. 8). This is also aligned with Davy’s research in Haiti [34].
⁃ The quality of the material used and of the construction works are poor (see Figs. 8 and 9) as already found by other studies [10,34,35].
⁃ Inadequate lap splices and rebar development length. Often, in beams and columns, stirrups are not present (see Fig. 9).
⁃ Additional floors are built many years later: the reinforcement bars are rusted, and floors are not aligned (see Figs. 8 and 9). Furthermore, the proximity to the sea facilitates rebars rusting and concrete spalling.
⁃ The connection between the infill walls and the columns is not adequate: in CM columns and beams should collaborate with walls (see Figs. 11 and 13). This may also be one of the causes of predominant wall damage, as reported in Tables 4 and 5
⁃ Unreinforced wall panels are too large and prone to out-of-plane failure (see Fig. 11). This may also be one of the causes of predominant wall damage, as reported in Tables 4 and 5
⁃ Extensive soil liquefaction was observed in Les Cayes and other geographical areas (see Fig. 7), where various buildings tilted due to the soil loss of strength. In these cases, the superstructure could suffer little damage or the slab-on-grade could crack due to the settlement (see Fig. 12).
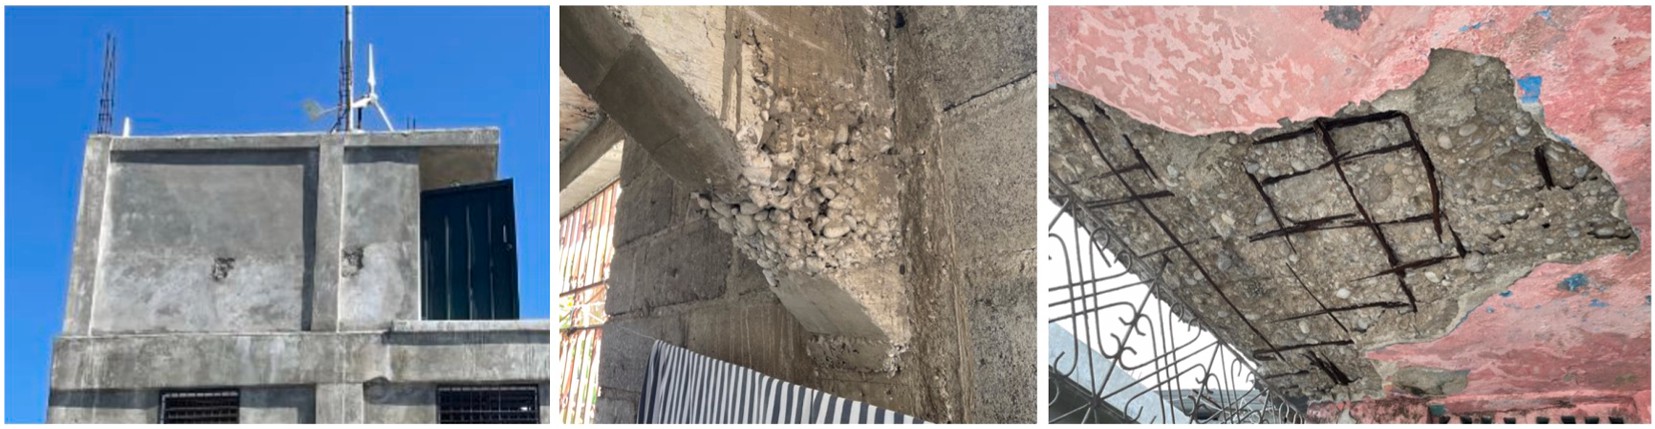
Fig. 8. Additional floor not aligned with the columns below and with rusted starter bars (left), concrete pour where aggregates are concentrated at the bottom (center), underside of a concrete slab where rusted bars spalled concrete cover (right) (Les Cayes, 2021).
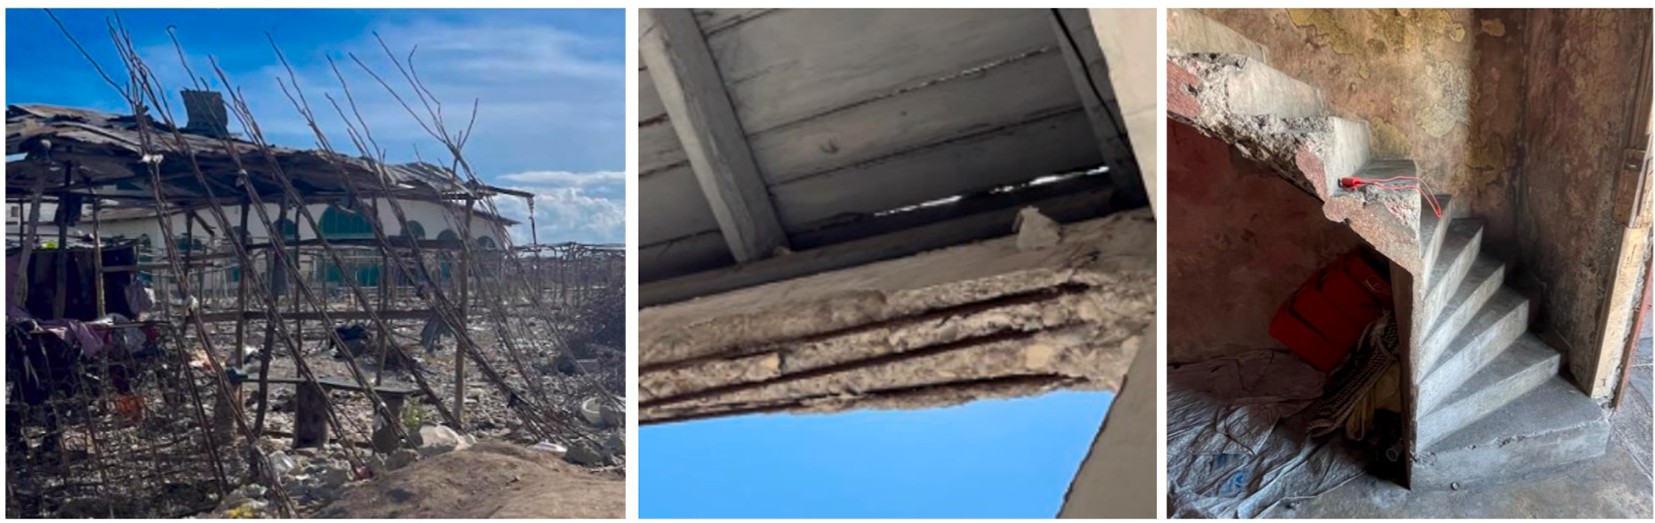
Fig. 9. Bars collected from collapsed buildings, straightened and ready to be sold at Les Cayes market (left), concrete beam with no stirrups and rusted reinforcement that spalled concrete cover (center), staircase (right) (Les Cayes, 2021).
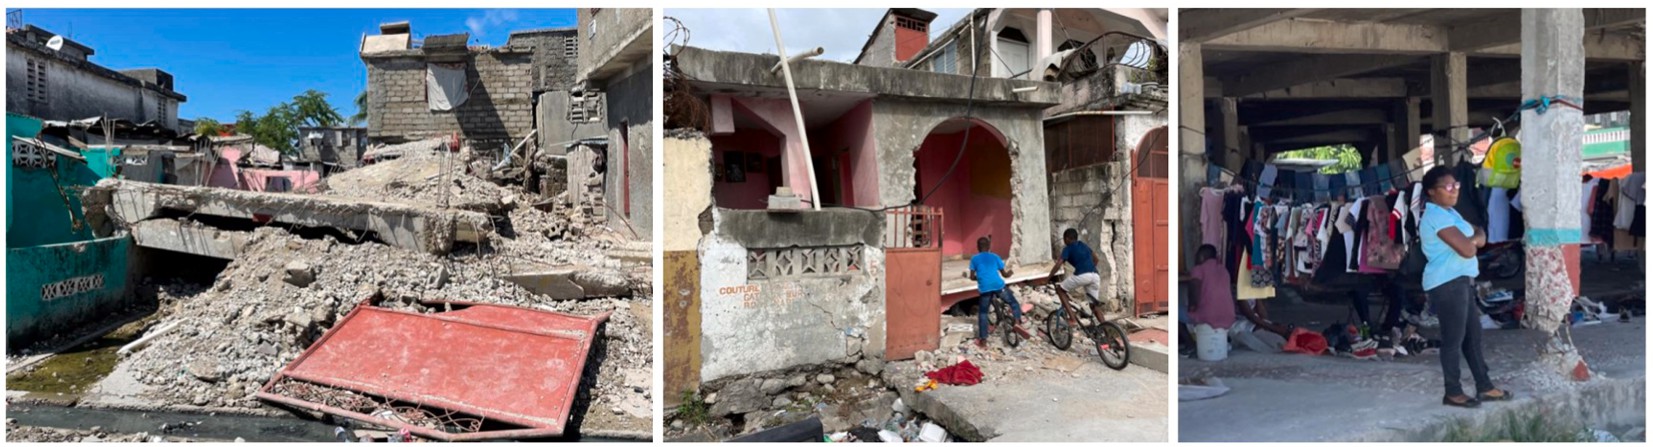
Fig. 10. “Pancakes” collapse (left), “soft story” collapse (center), column damage (right) (Les Cayes, 2021).
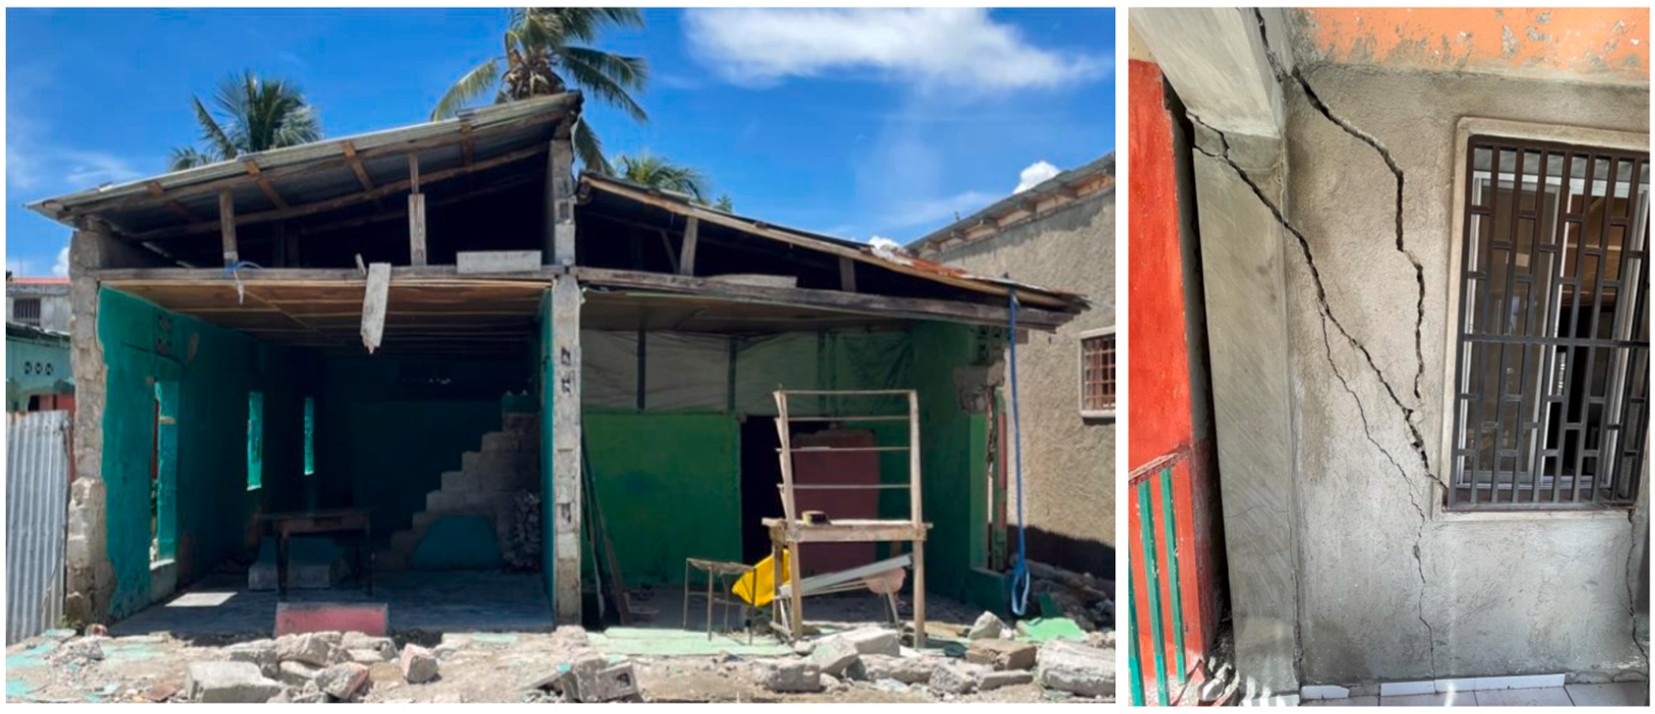
Fig. 11. Wall collapse with no connection to perpendicular walls (left), cracks running on walls, columns and beams indifferently (right) (Les Cayes, 2021).
⁃ Proper CM buildings had horizontal reinforced seismic bands at windows’ sill and lintel levels, vertical reinforced bands to reduce the size of the wall panels, columns and vertical bands, tied with the masonry walls. These buildings performed considerably better than load bearing buildings and poorly built CM buildings (see Figs. 10, 11 and 13).
MTPTC guidelines [5] are available with no charge for masons and members of the public. They are robust and technically sound standards for CM that address every aspect of a building construction. Unfortunately, most of the buildings do not appear to be com- pliant. MTPTC, UNOPS and Miyamoto are currently undertaking a homeowners and masons training campaign that with approxi- mately 12,000 beneficiaries across the departments of Sud, Grand’Anse and Nippes. The goal is to foster the Build Back Better strat- egy and get the local stakeholders more familiar with the proper standards.
The traditional house technique combines two very different structural systems: (i) the timber frame, that consists of the timber posts, beams and roof. It’s a very light and flexible component. And (ii) the stone masonry walls, a heavy and non-ductile component (see Fig. 14).
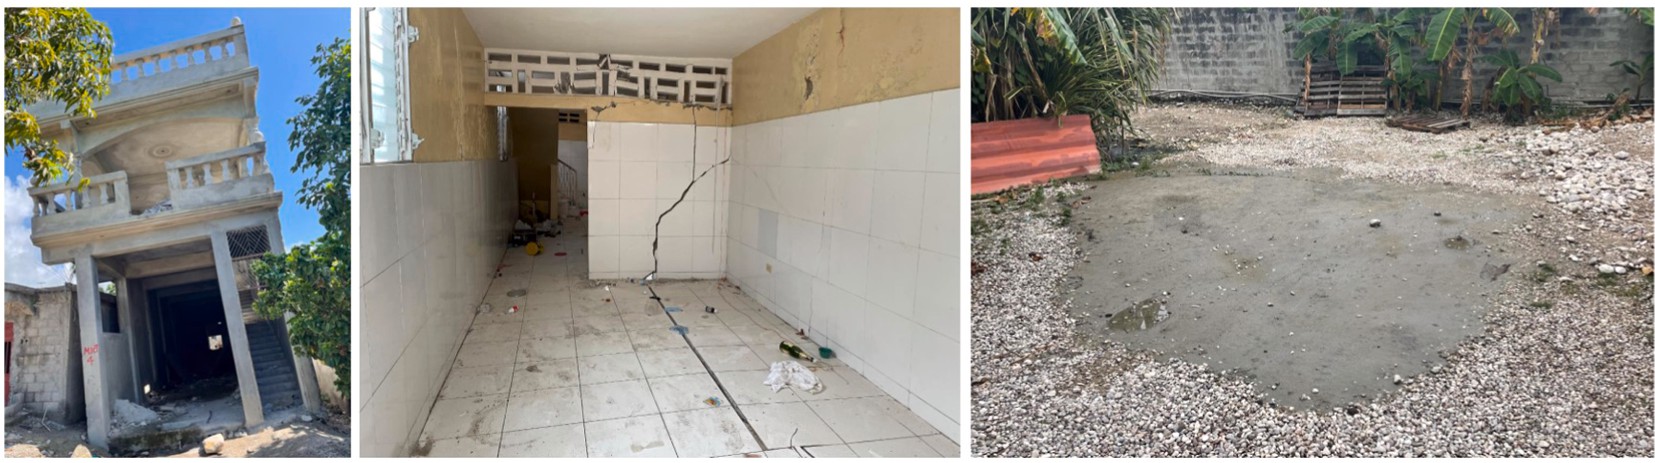
Fig. 12. Pending building due to liquefaction (left), building settlement due to liquefaction (center), sand boil due to liquefaction (right) (Les Cayes, 2021).
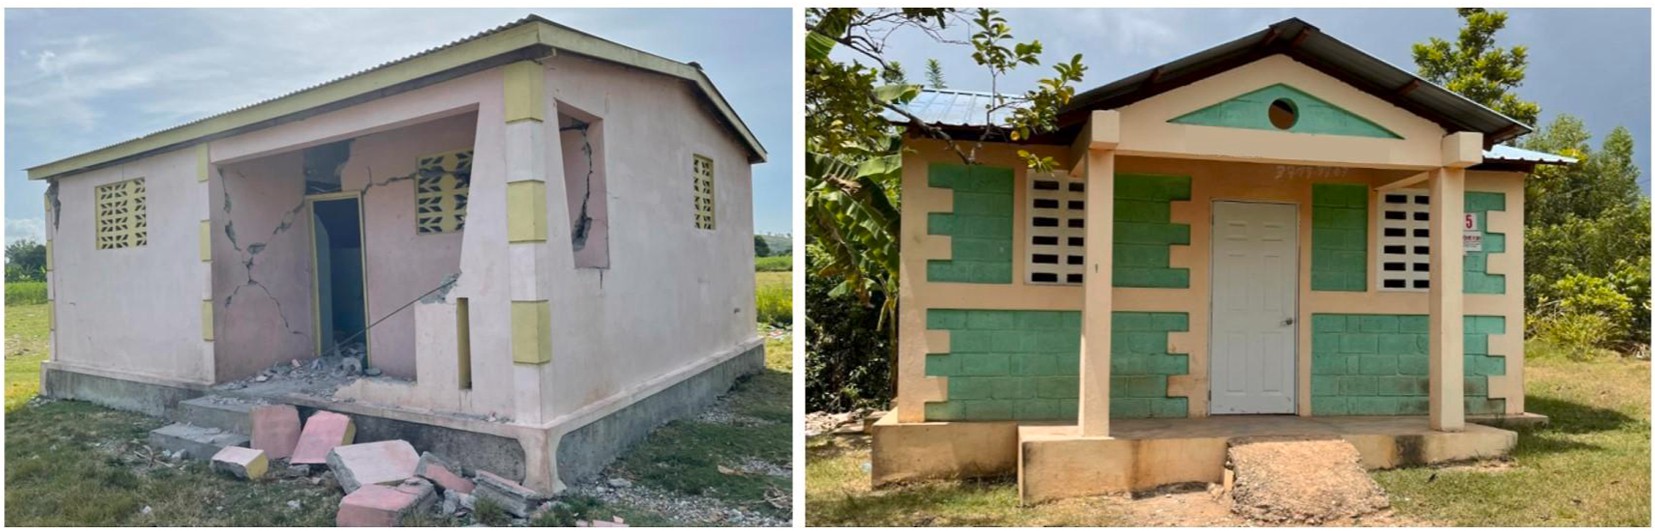
Fig. 13. Load bearing masonry (left), confined masonry (right) (Cavaillon, 2021).
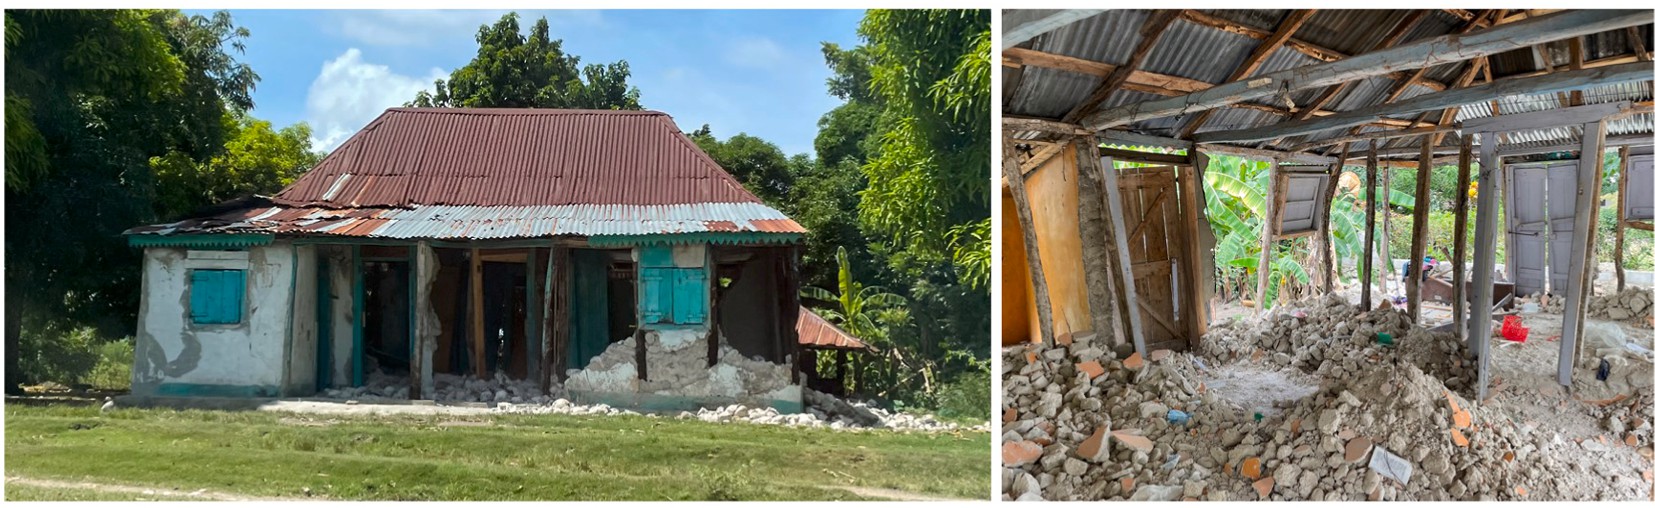
Fig. 14. Typical damaged traditional house (Les Cayes 2021 and Cavaillon 2021).
The observed seismic behavior is as follows: these two different systems collaborate to withstand vertical gravity forces that occur permanently. But when horizontal forces such as earthquakes occur, the system decouples in its two components. The heavy non- ductile one (the stone walls) collapses, while the light flexible one (the timber structure) resists the horizontal forces. In fact, the flexi- bility of the timber structure cannot be accommodated by the infill masonry walls and the stones roll off the walls. At that point the light and flexible timber structure has very little seismic weight to carry and is able to withstand the horizontal forces dissipating the energy in its joints. This is also aligned with the findings outlined in Table 4, that show wall damage as most recurring type of damage regardless of the assigned tag.
The system is decoupled in its two components because the infill walls and the timber elements are not connected to each other. The walls have no mean to transfer the horizontal load to the timber structure. As a result, the walls collapse out-of-plane and cannot develop any diagonal strut, which would stiffen the structure working in compression. As claimed in other studies [20–22], the au- thors observed an overall satisfactory seismic performance by these vernacular buildings, as complete collapse and loss of lives were extremely rare.
Comparison between 2010 and 2021 Haiti earthquakes
Compared to the 2010 earthquake [12], which heavily affected the densely populated capital city of Port-au-Prince and its sur- roundings, the 2021 earthquake had the epicenter in a rural area, and it impacted medium-sized cities and small villages in a more ex- tended range. The settlements are equally informal and not regulated; however, being more rural, almost half of the evaluated build- ings are in vernacular techniques (e.g. timber and stones). CM represents the other half of the assessed buildings and presented criti-
calities similar to the ones that were identified in 2010 [10,12]: low quality of the construction material and inadequate structural de- tails. Wall cracking is the predominant CM damage type for both earthquakes. The interpretation of the authors is that the implemen- tation of CM MTPTC standards, which were produced after the 2010 earthquake, remained mostly confined in the reconstruction around Port-au-Prince and did not sufficiently impact the existing buildings of the Sud, Grand’Anse and Nippes department. As a re- sult, the vulnerability of that part of CM built environment did not change.
Despite the difference in the number of fatalities (2010 earthquake are 100 times more, see Table 9), the 2021 earthquake appears to have caused more damage: 61% damaged buildings against 46%, 40.8% yellow buildings against 26%, although the data of col- lapsed buildings due to 2010 earthquake is not clear. The authors reckon that it could be due to (i) the higher number of completely collapsed buildings and (ii) the density of population that is much higher in Port-au-Prince, compared to the departments affected by the 2021 seismic event.
Limitations
Data on collapsed buildings is incomplete due to the impossibility of always collecting or understanding all the necessary informa- tion (e.g. the number of floors, building use, construction typology and so forth) in such cases. As a result, the data collected on some collapsed buildings are partial and an analysis that could have provided interesting insights on the structures that performed worst during the earthquake cannot be implemented. Furthermore, geotechnical studies could also analyze the potential influence of local soil amplification effects on the observed damage; although the geology, topography and sediments’ location that could have caused site effects on the seismic motions in the south-west regions of Haiti need further exploration in the current literature. Fragility curves define the probability of exceeding specific damage levels in function of the seismic intensity and predictive analytics may be pursued once fitting functions (namely, mathematical models able to describe the distribution of damages) are found; future studies focused on advanced structural engineering and with adequate knowledge of some details (e.g. construction material strength) could investi- gate further the Haitian built environment and its potential seismic performance also through fragility curves and predictive analysis.
Conclusions
In response to the M7.2, 2021 Haiti earthquake, 179,800 buildings have been assessed in less than five months. The built environ- ment in the departments of Sud, Grand’Anse and Nippes is vulnerable to seismic hazard, as 61% of the evaluated buildings were dam- aged. The observed damage to buildings increases as the PGA increases and as the building’s age increases. Liquefaction impacted ap- proximately 4000 buildings and the large majority of them were red tagged. Red tags in low PGA areas could be due to liquefaction, low quality construction of CM buildings and a higher susceptibility to damage of vernacular buildings. The behavior of buildings with more than one elevated slab was better than single-story buildings, although the latter represents 85% of the assessed building stock and there are less data on high structures. This could be due to a more formal construction process for higher buildings, as ver- nacular architecture is practically excluded, or inherent characteristics of the seismic motion (e.g. more solicitated periods of vibra- tion). The most recurrent type of damage is wall damage, as walls have been conceived as one of the first items to collapse in vernacu- lar architecture and have been observed to be of general poor quality in CM.
Compared to 2010 Haiti earthquake, the 2021 earthquake struck in a rural area, and a larger and less densely populated portion of the island was impacted. The number of victims is considerably low, although the damage ratio is higher. This is probably due to less densely populated areas and less buildings completely collapsing.
CM buildings showed structural weaknesses and types of damage similar to the ones observed in 2010. Construction material qual- ity is generally low quality and the structural details are inadequate (e.g. insufficient and rusted rebars, insufficient concrete cover, large and round aggregates). Although, when well built, CM proved to be more resistant than load-bearing masonry. The most com- mon repair details are wall replacement due to shear cracks in its plane, followed by crack repairs and wall connections repair.
Due to the position of the epicenter, more traditional buildings than the 2010 earthquake were observed (almost half of the total evaluations): the most common vernacular technique is timber frame with unreinforced stone masonry infill walls. Under a lifesaving perspective, they performed well: the typical damage is the infill walls collapse, which free the timber structure from the walls’ seis-
mic weight. This piece of research is aligned with other studies that found traditional techniques worth of special mention for their re- silience to natural hazards.
The authors thereby claim that more work needs to be done to enhance the confined masonry structures across the country before another major seismic event strikes. Improving the quality of the construction material and ensuring the compliance of structural de- tails to MTPTC guidelines are priorities.
We have also requested via email if an additional author (highlighted above) that supported us to produce the best possible review of the paper could be added. We wait for the Editorial Team decision and thank you for the consideration.
Credit authorship contribution statement
H. Kit Miyamoto: Supervision, Funding acquisition, Conceptualization. Giulia Jole Sechi: Writing – review & editing, Writ- ing – original draft, Project administration, Formal analysis, Data curation, Conceptualization. Guilaine Victor: Funding acquisi- tion, Conceptualization. Beverly St Come: Resources, Methodology, Investigation. Mark Broughton: Validation, Supervision, Methodology. Amir S.J. Gilani: Validation, Supervision, Software, Methodology. Akanksha Singh: Writing – review & editing.
Declaration of competing interest
The authors declare the following financial interests/personal relationships which may be considered as potential competing in- terests:All the authors reports financial support was provided by United Nations Office for Project Services. All the authors reports a relationship with World Bank Group that includes: funding grants.
Data availability
The authors do not have permission to share data.
Acknowledgements
The authors would like to express their heartfelt gratitude to the World Bank, MTPTC and UNOPS, for their essential financial, technical, and logistical support. It is thanks to the efforts of Raymond Hygin (Ingénieur Directeur des Travaux Publics), Felipe Munevar and Mathieu Bastien (UNOPS), Subhajit Das and Zach Johnson (Miyamoto International), together with hundreds of other engineers, community facilitators and drivers, that we were able to produce this piece of research. A special acknowledgement to all the workers who have spent many months on the field, despite the challenging socio-political times that Haiti is living.
References
- USGS, USGS Earthquake Hazards Program, 2021. https://earthquake.usgs.gov/. (Accessed 15 April 2021).
- R. Okuwaki, W. Fan, Oblique convergence causes both thrust and strike-slip ruptures during the 2021 M 7.2 Haiti earthquake, Geophys. Res. Lett. 49 (2022), https://doi.org/10.1029/2021GL096373.
- European Civil Protection And Humanitarian Aid Operations, Haiti earthquake – update, emergency response coordination centre, https:// erccportal.jrc.ec.europa.eu/ECHO-Products/Echo-Flash#/daily-flash-archive/4282, 2021. (Accessed 14 June 2022).
- UN-OCHA, Business Guide: Haiti Earthquake Humanitarian Response, Reliefweb, 2021. https://reliefweb.int/report/haiti/business-guide-haiti-earthquake- humanitarian-response-august-2021. (Accessed 14 June 2022).
- MTPTC, Ministère des Travaux Publics, Transports et Communications – République d’Haïti: Guide de Construction et de Reparation, (n.d.). https:// www.mtptc.gouv.ht/accueil/publications/code-construction.html (accessed June 16, 2022).
- ATC-20, PROCEDURES FOR POSTEARTHQUAKE SAFETY EVALUATION OF BUILDINGS, 1989. https://www.atcouncil.org/.
- T. Rossetto, A.J. Kappos, L.A. Kouris, M. Indirli, R.P. Borg, T.O. Lloyd, V. Sword-Daniels, Comparison of damage assessment methodologies for different natural hazards, in: COST ACTION C26: Urban Habitat Constructions under Catastrophic Events – Proceedings of the Final Conference, 2010.
- A. Frankel, S. Harmsen, C. Mueller, E. Calais, J. Haase, Seismic hazard maps for Haiti, Earthq. Spectra 27 (2011), https://doi.org/10.1193/1.3631016.
- Y. Torres, S. Molina, S. Martínez-Cuevas, M. Navarro, J.J. Martínez-Díaz, B. Benito, J.J. Galiana-Merino, D. Belizaire, A first approach to earthquake damage estimation in Haiti: advices to minimize the seismic risk, Bull. Earthq. Eng. 14 (2016), https://doi.org/10.1007/s10518-015-9813-3.
- J.D. Marshall, A.F. Lang, S.M. Baldridge, D.R. Popp, Recipe for disaster: construction methods, materials, and building performance in the January 2010 Haiti earthquake, Earthq. Spectra 27 (2011), https://doi.org/10.1193/1.3637031.
- R. DesRoches, M. Comerio, M. Eberhard, W. Mooney, G.J. Rix, Overview of the 2010 Haiti earthquake, Earthq. Spectra 27 (2011), https://doi.org/10.1193/ 1.3630129.
- H.K. Miyamoto, A.S.J. Gilani, K. Wong, Massive damage assessment program and repair and reconstruction strategy in the aftermath of the 2010 Haiti earthquake, Earthq. Spectra 27 (2011) 219–237, https://doi.org/10.1193/1.3631293.
- W.H. Bakun, C.H. Flores, U.S. ten Brink, Significant earthquakes on the Enriquillo fault system, Hispaniola, 1500–2010: implications for seismic hazard, Bull. Seismol. Soc. Am. 102 (2012) 18–30, https://doi.org/10.1785/0120110077.
- R.A. Green, S.M. Olson, B.R. Cox, G.J. Rix, E. Rathje, J. Bachhuber, J. French, S. Lasley, N. Martin, Geotechnical aspects of failures at port-au-prince seaport during the 12 January 2010 Haiti earthquake, Earthq. Spectra 27 (2011), https://doi.org/10.1193/1.3636440.
- S.M. Olson, R.A. Green, S. Lasley, N. Martin, B.R. Cox, E. Rathje, J. Bachhuber, J. French, Documenting liquefaction and lateral spreading triggered by the 12 January 2010 Haiti earthquake, Earthq. Spectra 27 (2011), https://doi.org/10.1193/1.3639270.
- H. Panuntun, The 2021 Mw 7.2 Haiti Earthquake: Rupture of a Blind Thrust Fault Revealed by Space Geodetic Observations, Essoar.Org, 2021, https://doi.org/ 10.1002/ESSOAR.10508758.1.
- J. Maurer, R. Dutta, A. Vernon, S. Vajedian, Complex rupture and triggered aseismic creep during the 14 August 2021 Haiti earthquake from satellite geodesy, Geophys. Res. Lett. 49 (2022), https://doi.org/10.1029/2022GL098573.
- R. Okuwaki, W. Fan, Oblique convergence causes both thrust and strike-slip ruptures during the 2021 M 7.2 Haiti earthquake, Geophys. Res. Lett. 49 (2022) e2021GL096373, https://doi.org/10.1029/2021GL096373.
- CALTEC, NASA, Satellite data shows ground motion from August 2021 Haiti earthquake, https://www.jpl.nasa.gov/images/pia23697-satellite-data-shows- ground-motion-from-august-2021-haiti-earthquake, 2021. (Accessed 30 June 2022).
- A. Dutu, K. Miyamoto, G.J. Sechi, S. Kishiki, Timber framed masonry houses: resilient or not? in: European Conference on Earhtquake Engineering and Seismology, 2022, pp. 2028–2036. https://www.researchgate.net/publication/363294643_Timber_framed_masonry_houses_resilient_or_not. (Accessed 12
September 2022).
- J.F. Audefroy, Haiti: post-earthquake lessons learned from traditional construction 23 (2011) 447–462, https://doi.org/10.1177/0956247811418736.
- A. Caimi, H. Guillaud, O. Moles, F. Vieux-Champagne, P. Garnier, S. Grange, Y. Sieffert, L. Daudeville, Traditional and scientific knowledge for a sustainable vulnerability reduction of rural housing in Haiti, in: Structures and Architecture: Concepts, Applications and Challenges – Proceedings of the 2nd International Conference on Structures and Architecture, ICSA 2013, 2013, pp. 1807–1815, https://doi.org/10.1201/B15267-247/EXAMINING-ARCHITECTURAL-ENGINEER- UIHLEIN.
- L. Holliday, H. Grant, Haiti building failures and a replicable building design for improved earthquake safety, Earthq. Spectra 27 (2011), https://doi.org/ 10.1193/1.3636386.
- A.F. Lang, J.D. Marshall, Devil in the Details: Success and Failure of Haiti’s Nonengineered Structures (2011) 27, https://doi.org/10.1193/1.3638136.
- N. Carlevaro, G. Roux-Fouillet, T. Schacher, How to Build Safer Houses with Confined Masonry: A Guide for Masons, Practical Action Publishing, 2018, https:// doi.org/10.3362/9781780449883.000.
- World Bank, The World Bank in Haiti, The World Bank, 2019, p. 1. https://www.worldbank.org/en/country/haiti/overview.
- The World Bank, Haiti Digital Acceleration Program (P171976), 2020.
- Y. Torres, S. Molina, S. Martínez-Cuevas, M. Navarro, J.J. Martínez-Díaz, B. Benito, J.J. Galiana-Merino, D. Belizaire, A first approach to earthquake damage estimation in Haiti: advices to minimize the seismic risk, Bull. Earthq. Eng. 14 (2016) 39–58, https://doi.org/10.1007/s10518-015-9813-3.
- G. Lizarralde, The Invisible Houses: Rethinking and Designing Low-Cost Housing in Developing Countries, Routledge, Taylor & Francis Group, 2014, https:// doi.org/10.4324/9781315749600.
- KoBoToolbox | Data Collection Tools for Challenging Environments, (n.d.). https://www.kobotoolbox.org/(accessed August 1, 2022)..
- A. Penna, C. Calderini, L. Sorrentino, C.F. Carocci, E. Cescatti, R. Sisti, A. Borri, C. Modena, A. Prota, Damage to churches in the 2016 central Italy earthquakes, Bull. Earthq. Eng. 17 (2019) 5763–5790, https://doi.org/10.1007/s10518-019-00594-4.
- Y. Idris, P. Cummins, I. Rusydy, U. Muksin, Syamsidik, M.Y. Habibie, E. Meilianda, Post-earthquake damage assessment after the 6.5 Mw earthquake on december, 7th 2016 in Pidie Jaya, Indonesia, J. Earthq. Eng. 26 (2022) 409–426, https://doi.org/10.1080/13632469.2019.1689868.
- J. Atalić, M. Demšić, M. Baniček, M. Uroš, I. Dasović, S. Prevolnik, A. Kadić, M. Šavor Novak, M. Nastev, The December 2020 magnitude (Mw) 6.4 Petrinja earthquake, Croatia: seismological aspects, emergency response and impacts, Bull. Earthq. Eng. 21 (2023), https://doi.org/10.1007/s10518-023-01758-z.
- C. Davy, M.L. Blaisdell, K.M. Sinclair, E.H. Strand, Seismic retrofit of confined masonry houses in Haiti: lessons from implementation, in: 16th World Conference on Earthquake Engineering, 2017.
- A. Gordon, J.M. Plumblee, K. Dimarco, D. Vaughn, J. Ogle, Partnering with a local concrete block manufacturing plant to improve quality of construction materials in Haiti’s Central Plateau, Journal of Humanitarian Engineering 4 (2016), https://doi.org/10.36479/jhe.v4i2.58.